
Quick Graphviz Tutorial
Wed 02 January 2019 by Dr. Dirk Colbry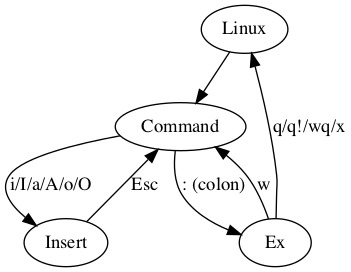
This quick tutorial shows provides basic instructions for generating the above graph using Graphviz.

If you already have Anaconda installed on your system, you can quickly install graphviz using the following command:
conda install graphviz
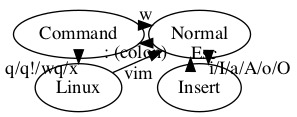
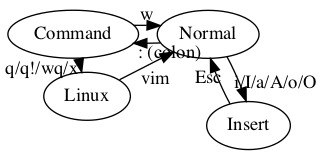
Once graphviz is installed you need to create a text file with the connections. This file is called a dot file. There are a lot of tutorials about the dot syntax but the basics is to make a list of nodes and their connections. For example, the following file (called test.dot) makes the figure above. Use the -> to indicate a directed link and a -- to indicate a bi-directional link:
digraph G {
 Linux -> Normal  [ label="vim" ];
 Normal  -> Insert  [ label="i/I/a/A/o/O" ];
 Insert  -> Normal [ label="Esc"];
 Normal  -> Command  [ label=": (colon)"];
 Command  -> Normal  [ label="w"];
 Command  -> Linux [ label="q/q!/wq/x"]
}
Once you have the file you can make an image using the following dot command (dot is one of the commands installed by Graphviz)
dot -Tpng test.dot -ovim.png
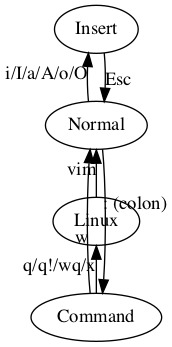
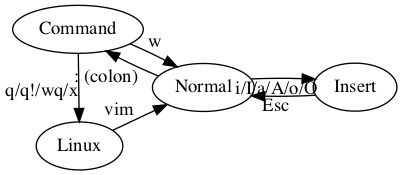
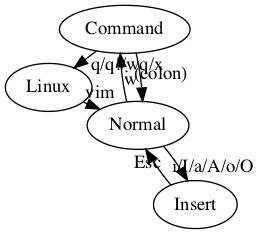
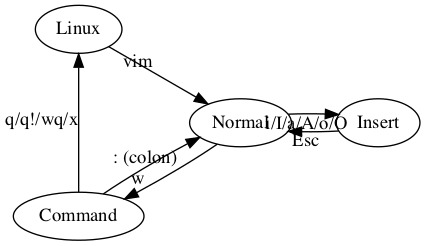
Just for fun, I tried my dot file with the other tools provided with Graphviz (twopim, sfdp, neato, osage, fdp, circo and patchwork). They don't look as good as dot (most of them mess up the line labels) however i could see that they may be useful (and easy) for other figures:

Hope you find this useful.