
10 In-Class Assignment: Eigenproblems

Image from: https://campusinvolvement.umich.edu/
Agenda for today’s class (80 minutes)
(20 minutes) Pre Class Review
(20 minutes) Introduction to Markov Models
(20 minutes) Another Markov Model Example
%matplotlib inline
import matplotlib.pylab as plt
import numpy as np
import sympy as sym
sym.init_printing(use_unicode=True)
---------------------------------------------------------------------------
ModuleNotFoundError                       Traceback (most recent call last)
<ipython-input-1-e3122a161773> in <module>
----> 1 get_ipython().run_line_magic('matplotlib', 'inline')
      2 import matplotlib.pylab as plt
      3 import numpy as np
      4 import sympy as sym
      5 sym.init_printing(use_unicode=True)

~/REPOS/MTH314_Textbook/MakeTextbook/envs/lib/python3.9/site-packages/IPython/core/interactiveshell.py in run_line_magic(self, magic_name, line, _stack_depth)
   2342                 kwargs['local_ns'] = self.get_local_scope(stack_depth)
   2343             with self.builtin_trap:
-> 2344                 result = fn(*args, **kwargs)
   2345             return result
   2346

~/REPOS/MTH314_Textbook/MakeTextbook/envs/lib/python3.9/site-packages/decorator.py in fun(*args, **kw)
    230             if not kwsyntax:
    231                 args, kw = fix(args, kw, sig)
--> 232             return caller(func, *(extras + args), **kw)
    233     fun.__name__ = func.__name__
    234     fun.__doc__ = func.__doc__

~/REPOS/MTH314_Textbook/MakeTextbook/envs/lib/python3.9/site-packages/IPython/core/magic.py in <lambda>(f, *a, **k)
    185     # but it's overkill for just that one bit of state.
    186     def magic_deco(arg):
--> 187         call = lambda f, *a, **k: f(*a, **k)
    188
    189         if callable(arg):

~/REPOS/MTH314_Textbook/MakeTextbook/envs/lib/python3.9/site-packages/IPython/core/magics/pylab.py in matplotlib(self, line)
     97             print("Available matplotlib backends: %s" % backends_list)
     98         else:
---> 99             gui, backend = self.shell.enable_matplotlib(args.gui.lower() if isinstance(args.gui, str) else args.gui)
    100             self._show_matplotlib_backend(args.gui, backend)
    101

~/REPOS/MTH314_Textbook/MakeTextbook/envs/lib/python3.9/site-packages/IPython/core/interactiveshell.py in enable_matplotlib(self, gui)
   3511         """
   3512         from IPython.core import pylabtools as pt
-> 3513         gui, backend = pt.find_gui_and_backend(gui, self.pylab_gui_select)
   3514
   3515         if gui != 'inline':

~/REPOS/MTH314_Textbook/MakeTextbook/envs/lib/python3.9/site-packages/IPython/core/pylabtools.py in find_gui_and_backend(gui, gui_select)
    278     """
    279
--> 280     import matplotlib
    281
    282     if gui and gui != 'auto':

ModuleNotFoundError: No module named 'matplotlib'
2. Introduction to Markov Models
In probability theory, a Markov model is a stochastic model used to model randomly changing systems. It is assumed that future states depend only on the current state, not on the events that occurred before it.
A diagram representing a two-state Markov process, with the states labelled E and A.
Each number represents the probability of the Markov process changing from one state to another state, with the direction indicated by the arrow. For example, if the Markov process is in state A, then the probability it changes to state E is 0.4, while the probability it remains in state A is 0.6.
From: Wikipedia
The above state model can be represented by a transition matrix.
In other words we can write the above as follows
A = np.matrix([[0.6, 0.7],[0.4, 0.3]])
sym.Matrix(A)
Notice how the columns in the matrix all add to one. This is because all of the transition probabilities out of a matrix must add to 100 percent.
Now, consider the following house map with cats in each room…
At each time step, there is an equal probability of a cat staying in their current room or moving to a new room. If a cat chooses to leave a room, then there is an equal chance of that cat picking any of the doors in the room to leave.
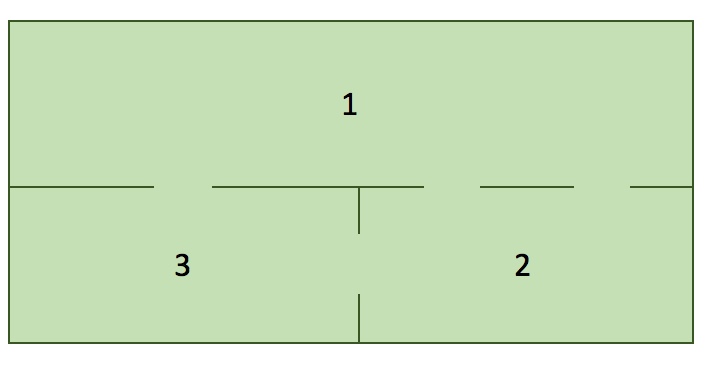
✅DO THIS : Try to draw a Markov chain (Markov matrix) for the above system of equations. Be prepared to share your diagram with the class.
A Markov chain can be represented as a Markov transition model of the form \(Ax=b\). Where \(A\) is your probability tranisition matrix (often represented as a \(P\) instead of an \(A\)). \(x\) is the state before the transition and \(b\) is the state after the transition.
✅QUESTION: Generate a Markov transition model represented as a matrix \(P\) of the form: $\( \begin{array}{ccc} & \text{Current Room} \\ P = & \begin{bmatrix} p_{11} & p_{12} & p_{13} \\ p_{21} & p_{22} & p_{23} \\ p_{31} & p_{32} & p_{33} \end{bmatrix} \end{array} \text{Next Room} \)$
Where \(p_{ij}\) are probability transitions of the cat moving between rooms (from room \(j\) to room \(i\)):
##put your answer here
from answercheck import checkanswer

checkanswer.matrix(P,'1001a6fa07727caf8ce05226b765542c');
✅QUESTION: Let’s assume that the system starts with; 6 cats in room 1, 15 cats in room 2, and 3 cats in room 3. How many cats will be in each room after one time step (Store the values in a vector called current_state)?
#Put your answer to the above question here.
from answercheck import checkanswer

checkanswer.vector(current_state,'98d5519be82a0585654de5eda3a7f397');
✅QUESTION: The following code will plot the number of cats as a function of time (\(t\)). When this system converges, what is the steady state?
#Define Start State
room1 = [6]
room2 = [15]
room3 = [3]

current_state = np.matrix([room1, room2, room3])

for i in range(10):
    #update Current State
    current_state = P*current_state

    #Store history for each room
    room1.append(current_state[0])
    room2.append(current_state[1])
    room3.append(current_state[2])

plt.plot(room1, label="room1");
plt.plot(room2, label="room2");
plt.plot(room3, label="room3");
plt.legend();
print(current_state)
Inspect the generated graaph and put your answer to the above question here
✅QUESTION: Calculate the eigenvalues and eigenvectors of your \(P\) transition matrix.
##put your answer here
The eigenvector associated with the eigenvalue of 1 represents the steady state probability for our original transition matrix \(P\).
✅DO THIS: make a new vector called steadystate from the eigenvector of your \(P\) matrix with a eigenvalue of 1.
## Put your answer here
Since the steadystate vectors represent long term probibilities, they should sum to one (1). However, most programming libraries (ex. numpy and sympy) return “normalized” eigenvectors to length of 1 (i.e. norm(e)==1).
✅DO THIS: Correct for the normalization by multiplying the steadystate eigenvector by a constant such that the sum of the vector elements add to 1.
#Put your answer here
✅DO THIS: Think about the cats problem, because one cat has to be in one of the three rooms. That means, the total number of cats will not change. If we add the number of cats at all rooms together, this number has to be the same. Therefore, if we start will 6+15+3=24 cats, there are also 24 cats at the steadystate. Modify the steadystate to make sure the total number of cats is 24.
✅QUESTION: Why does the sum of the numbers at every stage remain the same?
Put your answer here
3. Another Markov Model Example
A sports broadcaster wishes to predict how many Michigan residents prefer University of Michigan teams and how many prefer Michigan State teams. She noticed that, year after year, most people stick with their preferred team; however, about 5% of Michigan fans switch to Michigan State, and about 3% of Michigan State fans switch to Michigan each year. However, there is no noticeable difference in the state’s population of 10 million’s preference at large; in other words, it seems Michigan sports fans have reached a stationary distribution. What might that be?
This problem is from https://brilliant.org/wiki/stationary-distributions/
✅DO THIS: Try to draw a Markov chain for the above system of equations. Discuss your diagram with your classmate.
✅ QUESTION: Write a system of linear equations that represents how the populations change each year. Check your equations by writing the matrix P for the probability transitions matrix in your equations. Make sure your first row/column represents MSU and the second row/column represents UofM.
Put your answer here
from answercheck import checkanswer

checkanswer.vector(P,'1d3f7cbebef4b610f3b0a2d97609c81f');
✅ QUESTION: Calculate the eigenvalues and eigenvectors of your \(P\) transition matrix.
#Put the answer to the above quesiton here.
✅ QUESTION: Assuming each team starts with 500,000 fans, what is the steady state of this model? (i.e. in the long term how many Spartan and Wolverine fans will there be?).
#Put your answer here
steadystate
from answercheck import checkanswer

checkanswer.float(spartans,'06d263de629f4dbe51eafd524b69ddd9');
from answercheck import checkanswer

checkanswer.float(wolverines,'62d63699c8f7b886ec9b3cb651bba753');
Written by Dr. Dirk Colbry, Michigan State University

This work is licensed under a Creative Commons Attribution-NonCommercial 4.0 International License.